Table of Contents
- Used Stack
- New and updated NPM Packages
- New Header Component for Dashboard Page
- New Components for New Widgets
- TopDeviceWidget
- TopLocationsWidget
- TopSourceWidget
- TrendWidget
- Upgrade to tremor/react 3.1
- New Styling for the Dashboard
- Complete tailwind.config.ts
- Global.css
- And here is the final result with the new widgets
- Cloudapp-dev, and before you leave us
In this post, we will proceed with our analytics dashboard. We will add new styling with TailwindCss and new Widgets to our Dashboard, which we created in our existing Nextjs 14 project.
Here is the GitHub repo with the entire code. Below, you will find the link to the example page.
Example page hosted on Vercel -> https://nextjs14-kafka-tracking.vercel.app/
Used Stack
I will start with my default stack:
Next.js 14 as the web framework, and I will use the provided middleware edge function
TailwindCss for Styling
Contentful CMS (Free Plan)
Tinybird for Data Collection and Analytics
Vercel for hosting
New and updated NPM Packages
We need to install the new “@tailwindcss/forms” package and upgrade the tremor/react package from 2.0.2 to 3.10
New Header Component for Dashboard Page
We create a new Component to wrap the DateFilter and CurrentVisitors components.
And then, we import the new component into our Dashboard pages, replacing the old component.
New Components for New Widgets
CurrentVisitors is the widget we used in the new AnalyticsHeader.tsx
TopDeviceWidget
TopLocationsWidget
TopSourceWidget
TrendWidget
Upgrade to tremor/react 3.1
Due to the upgrade we have t adapt the Datefilter.tsx (src/components/webanalytics) and the hook file use-date-filter.ts (src/lib/hooks). In the old npm package 2.0.2 the type DateRangePicker was of type array (startdate, enddate, value), but now it changed.
Hook File
New Styling for the Dashboard
Now the new logic is in place, and therefore, we are gonna style it.
Complete tailwind.config.ts
Below the complete code
Global.css
The global.css was adapted as well
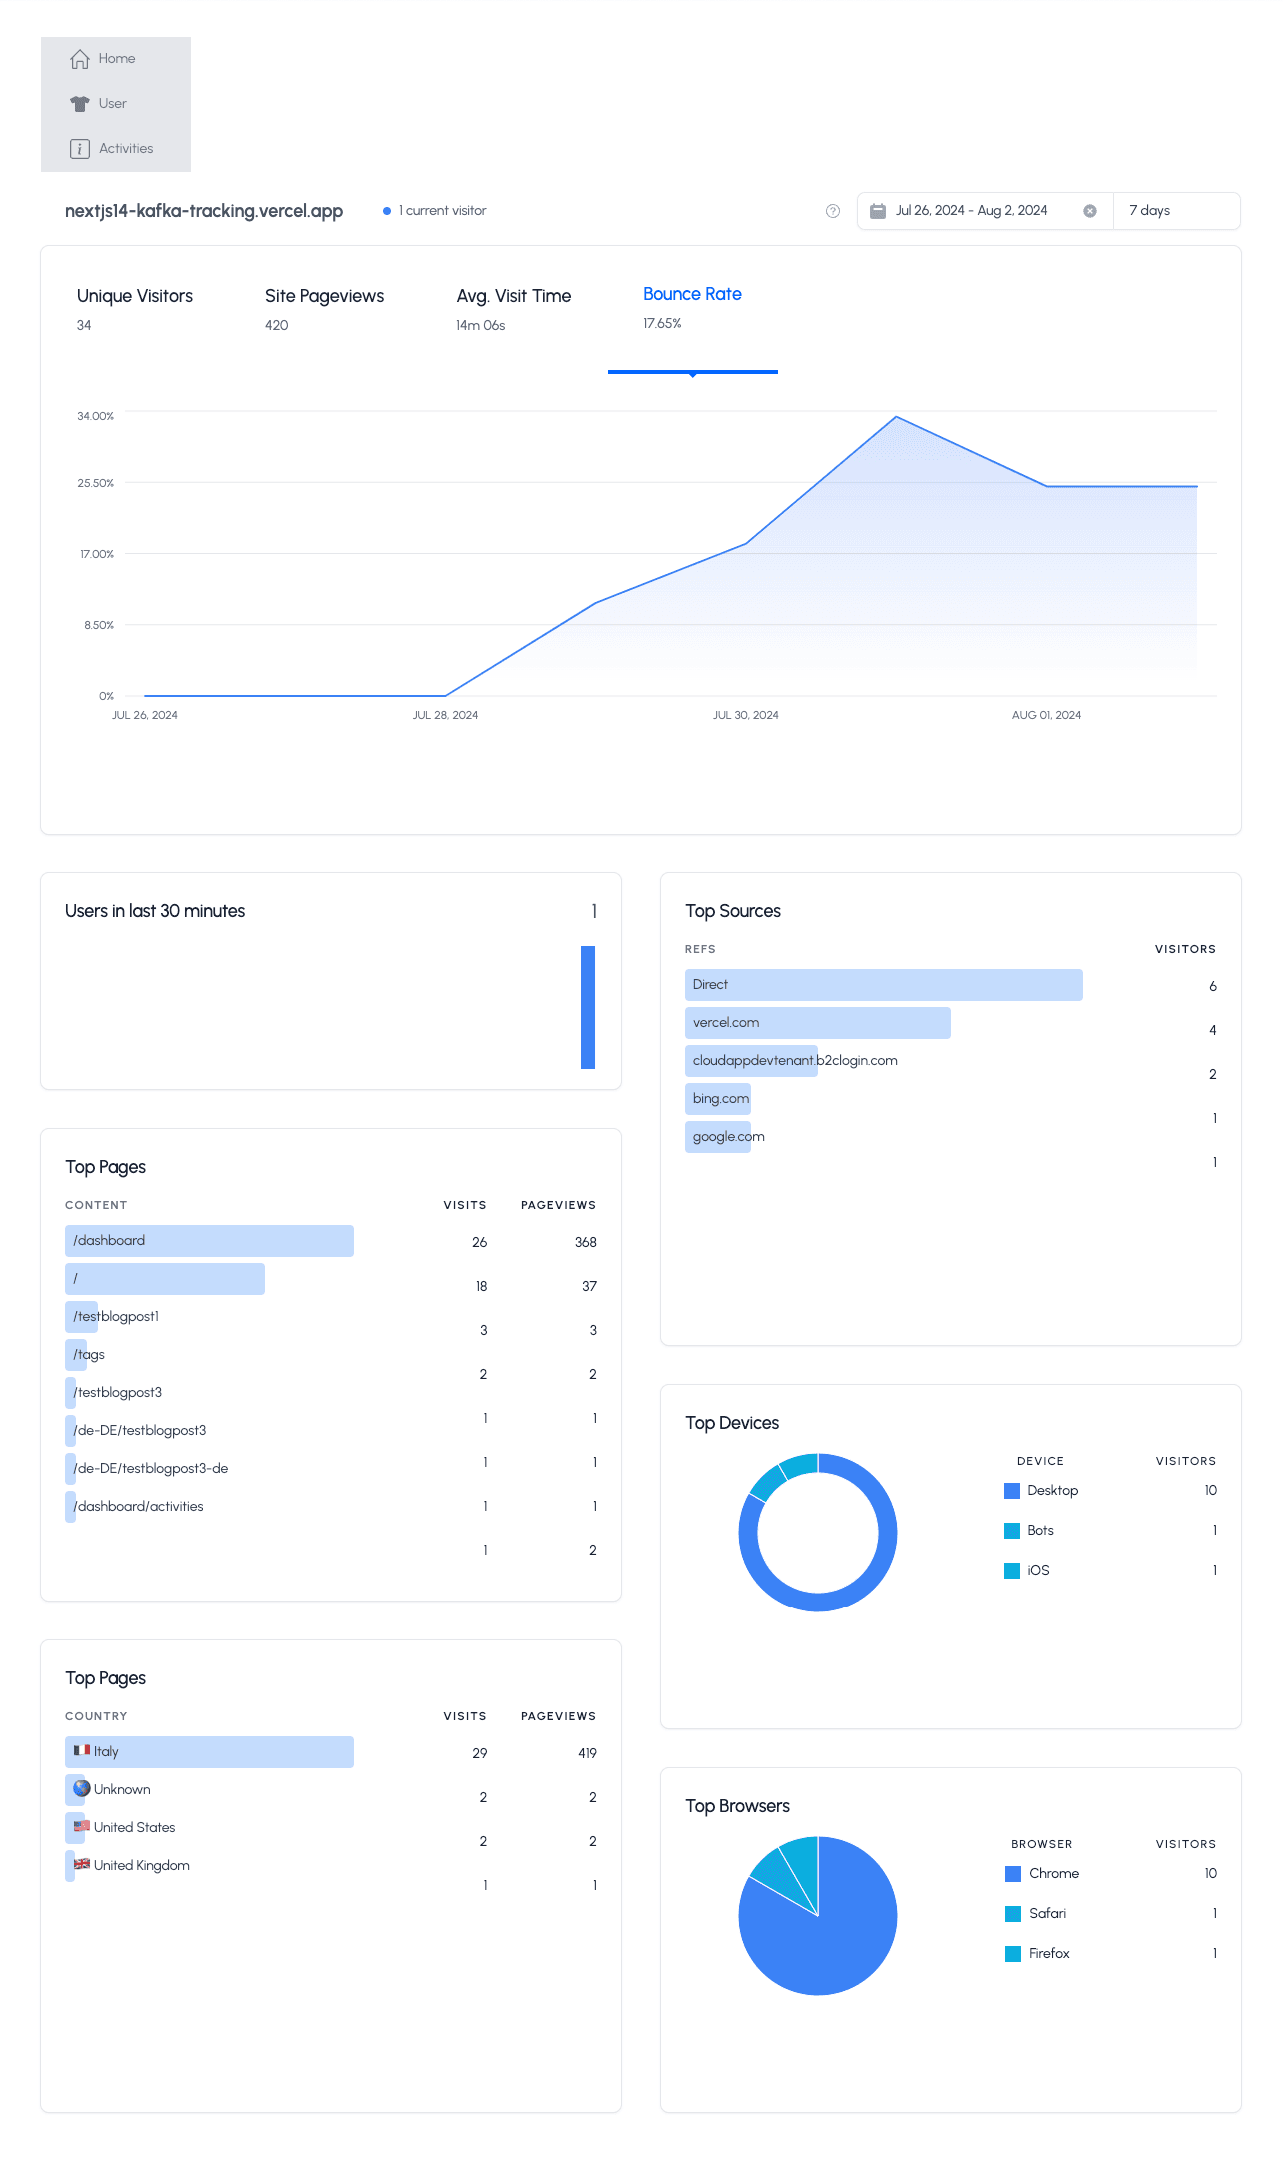
And here is the final result with the new widgets
Now, we can use the tabs in the top KPI widget. The colors of the PIE and DONUT charts are correct, and we can easily switch/change the date range.
Cloudapp-dev, and before you leave us
Thank you for reading until the end. Before you go: